Analysis
This is the first publicly available on-line inventory of nanotechnology-based consumer products.
The inventory is an essential resource for consumers, citizens, policymakers, and others who are interested in learning about how nanotechnology is entering the marketplace. It is meant to be international and expanding. Additions to the inventory will be made periodically, as new information is received. Users are encouraged to submit new and updated information to nano@wilsoncenter.org.
Summary Information
As of October 2013, the nanotechnology consumer products inventory contains 1628 products or product lines.
Products were grouped according to relevant main categories (Figure 2) that are loosely based on publicly available consumer product classification systems. The largest main category is Health and Fitness, with a total of 788 products. This includes products like cosmetics and sunscreens.
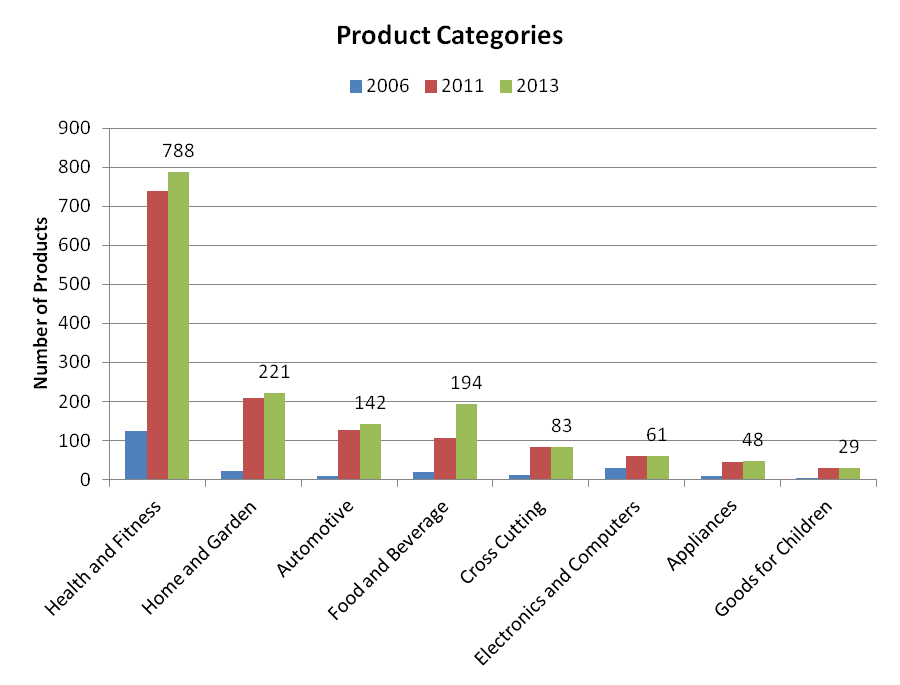
Products with relevance to multiple categories have been accounted for multiple times in Figure 2. Associated with each category are a number of appropriate sub-categories that allow for further organization of the products. For example, Paint is a sub-category under Home and Garden, while Display is a sub-category under Electronics and Computers. The Cross-Cutting category was included as a grouping of products that are multi-functional. Currently, the only sub-category under Cross-Cutting is Coatings. In addition, 88 products have a “generic” designation, indicating that they are commercial technologies that will be used in, or are currently appearing in, consumer products.
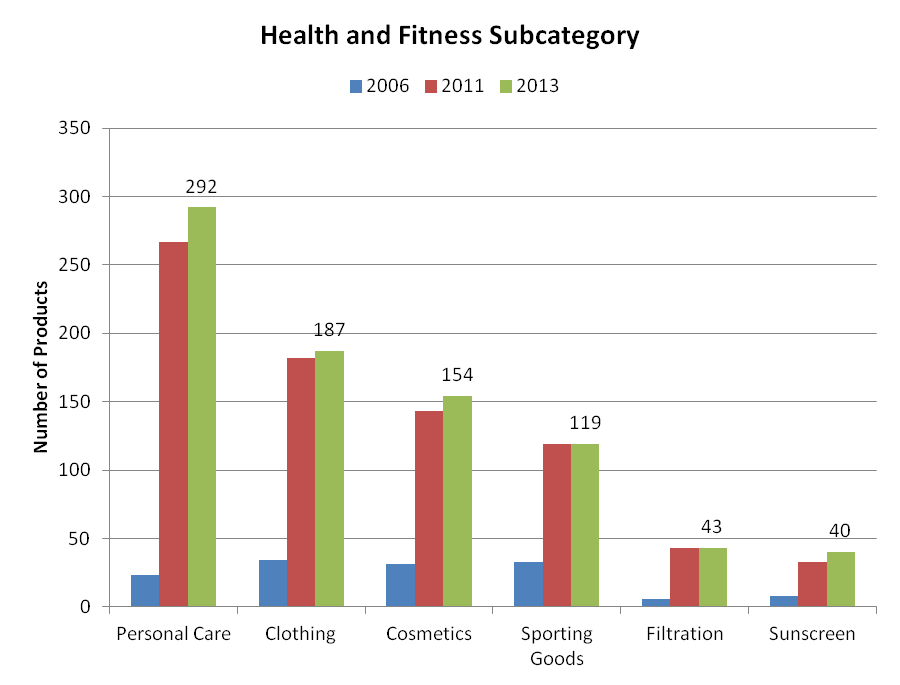
Figure 3 illustrates the sub-categories associated with the largest main category, Health and Fitness. It includes Cosmetics (154 products), Clothing (187), Personal Care (292), Sporting Goods (119), Sunscreen (40), and Filtration (43). Again, products with relevance to multiple categories have been accounted for multiple times. The Cosmetics, Clothing and Personal Care sub-categories are now the largest in the inventory.
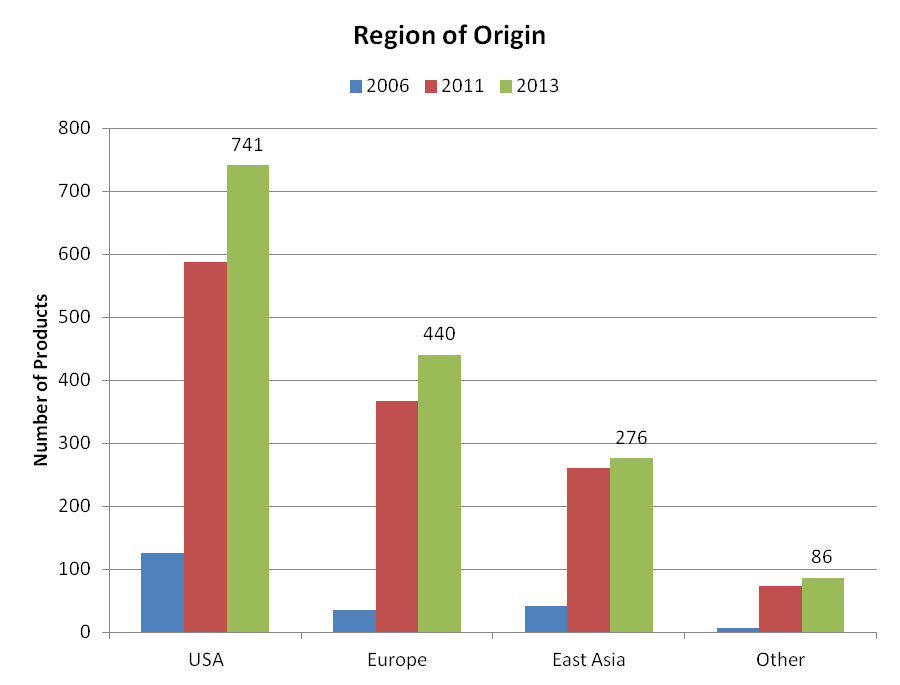
The inventory now includes products from 30 different countries. Figure 4 illustrates the breakdown of products by region (when identified) and indicates that companies based in the United States have the most products, with a total of 741, followed by companies in Europe (UK, France, Germany, Finland, Switzerland, Italy, Sweden, Denmark, The Netherlands) (440), East Asia (including China, Taiwan, Korea, Japan) (276), and elsewhere around the world (Australia, Canada, Mexico, Israel, New Zealand, Malaysia, Thailand, Singapore, The Philippines, Malaysia) (86).
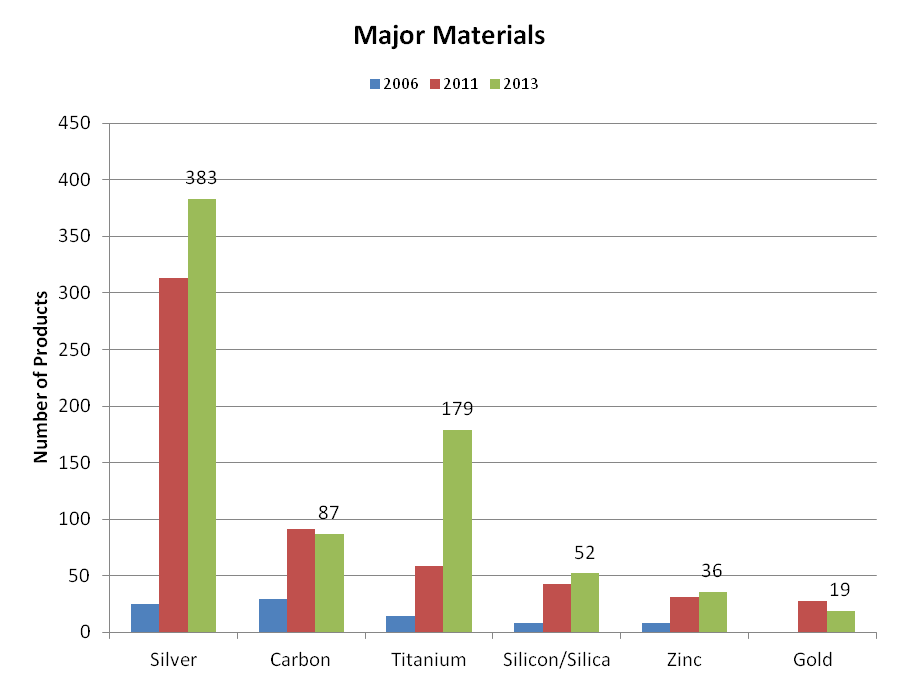
As Figure 5 indicates, there is a small set of nanomaterials explicitly referenced in consumer products. The most common material mentioned in the product descriptions is now silver (383 products). Titanium (179), which includes titanium dioxide, has surpassed Carbon (87), which includes fullerenes, followed by silica (52), zinc (including zinc oxide) (36), and gold (19).